Latest update April 4th, 2025 5:09 PM
Latest News
Here are the statistical disparities among school sectors
Oct 08, 2016 Letters
 Dear Editor;
Recently, Walter B. Alexander wrote a letter to you that posed the question: After 50 years of education, where are we now? In addition, he noted that, among other things, we need to take a backward glance at the 2016 National Grade Six Assessment (NGSA). While reams of paper may be needed for the question, I would like to inform him that a backward glimpse of the NGSA results was undertaken. Please note that while Walter B. Alexander and I share identical and independent concerns, we do not share either a professional or informal relationship, neither do I work for the government nor any entity with an interest in the NGSA.
An exploratory analysis using statistical modelling of the published scores from the top 1% of the 2016 NGSA was undertaken using multi-category logistic regression. Multi-category logit models take into consideration pairs of categories by examining the odds and the probabilities of outcome in one category instead of another. These models are in the family of statistical analysis that accounts for categorical data. In the exploratory analysis of the 2016 NGSA, schools were categorised as Private Religious, Private Secular or Public. These classifications were based on the school’s name and cross-checked with publicly available information. Among the top 2016 NGSA test takers, about 60% attended private schools. Notably, schools with at least ten students scoring among the top 1% of test takers had significant mean scores. These schools from different regions included Mae’s Under 12 (546.29), Success Elementary (545.42), and Academy of Excellence (545.13; Region 3).
The exploratory analysis used the available scores transformed into standard deviations. For every unit increase in the standard deviation, estimated odds of attending a Private Religious school over a Public school increases by 77%, the estimated odds of attending a Private Secular school over a Public school increases by 54%, and the estimated odds of a student attending a Private Religious over a Private Secular school increases by 15%.For this sample of students, at their mean score, at one standard deviation above the mean, and at two standard deviations above the mean, the chance that a student attended a Private Religious school was 22%, 28%, and 34%, respectively, a Private Secular school 40%, 45%, and 47%, and a Public School 38%, 27%, 19%. The relationship between school and scores were dependent. Simply put, the farther we move from the mean, the less representation we see from Public school students. If the present analysis suggests disparities among school sectors, then those factors that contribute to disadvantages need to be identified.
The bottom line is the need to study individual as well as school factors and to get a better understanding of where we, after 50 years, can afford higher academic achievement especially among Public school students. Some student level factors might include gender, math self-efficacy, reading ability, and parental involvement. Some school level factors could include the number of students who attend the particular school; teacher training and hours of professional development; and teacher satisfaction. The data needed to drive decisions should be made public. If the creation of a Center for Teaching and Learning at UG gets the required support, then the need to incorporate robust and longitudinal data collection for its researchers would create the partnership needed that would inform governmental policies.
Les Archer
Share this:
- Click to print (Opens in new window)
- Click to email a link to a friend (Opens in new window)
- Click to share on Facebook (Opens in new window)
- Click to share on WhatsApp (Opens in new window)
- Click to share on Twitter (Opens in new window)
- Click to share on Pinterest (Opens in new window)
- Click to share on Pocket (Opens in new window)
- Click to share on Tumblr (Opens in new window)
- Click to share on Reddit (Opens in new window)
- Click to share on LinkedIn (Opens in new window)
Related
Similar Articles

The Glenn Lall Show|| March, 31st, 2025
Follow on Tik Tok @Glennlall
THE BLUNT OF THE DAY

Sports
Apr 04, 2025
…19 teams to vie for top honours Kaieteur Sports- Basketball teams from around the world will be in action this weekend, when the ‘One Guyana’ 3×3 Quest gets underway. Competing for a...Features/Columnists
The reciprocal tariffs
Peeping Tom… Kaieteur News- Vice President Bharrat Jagdeo has once again proven his talent for making the indefensible... more
Publisher’s Note
Freedom of speech is our core value at Kaieteur News. If the letter/e-mail you sent was not published, and you believe that its contents were not libellous, let us know, please contact us by phone or email.
Feel free to send us your comments and/or criticisms.
Contact: 624-6456; 225-8452; 225-8458; 225-8463; 225-8465; 225-8473 or 225-8491.
Or by Email: glennlall2000@gmail.com / kaieteurnews@yahoo.com
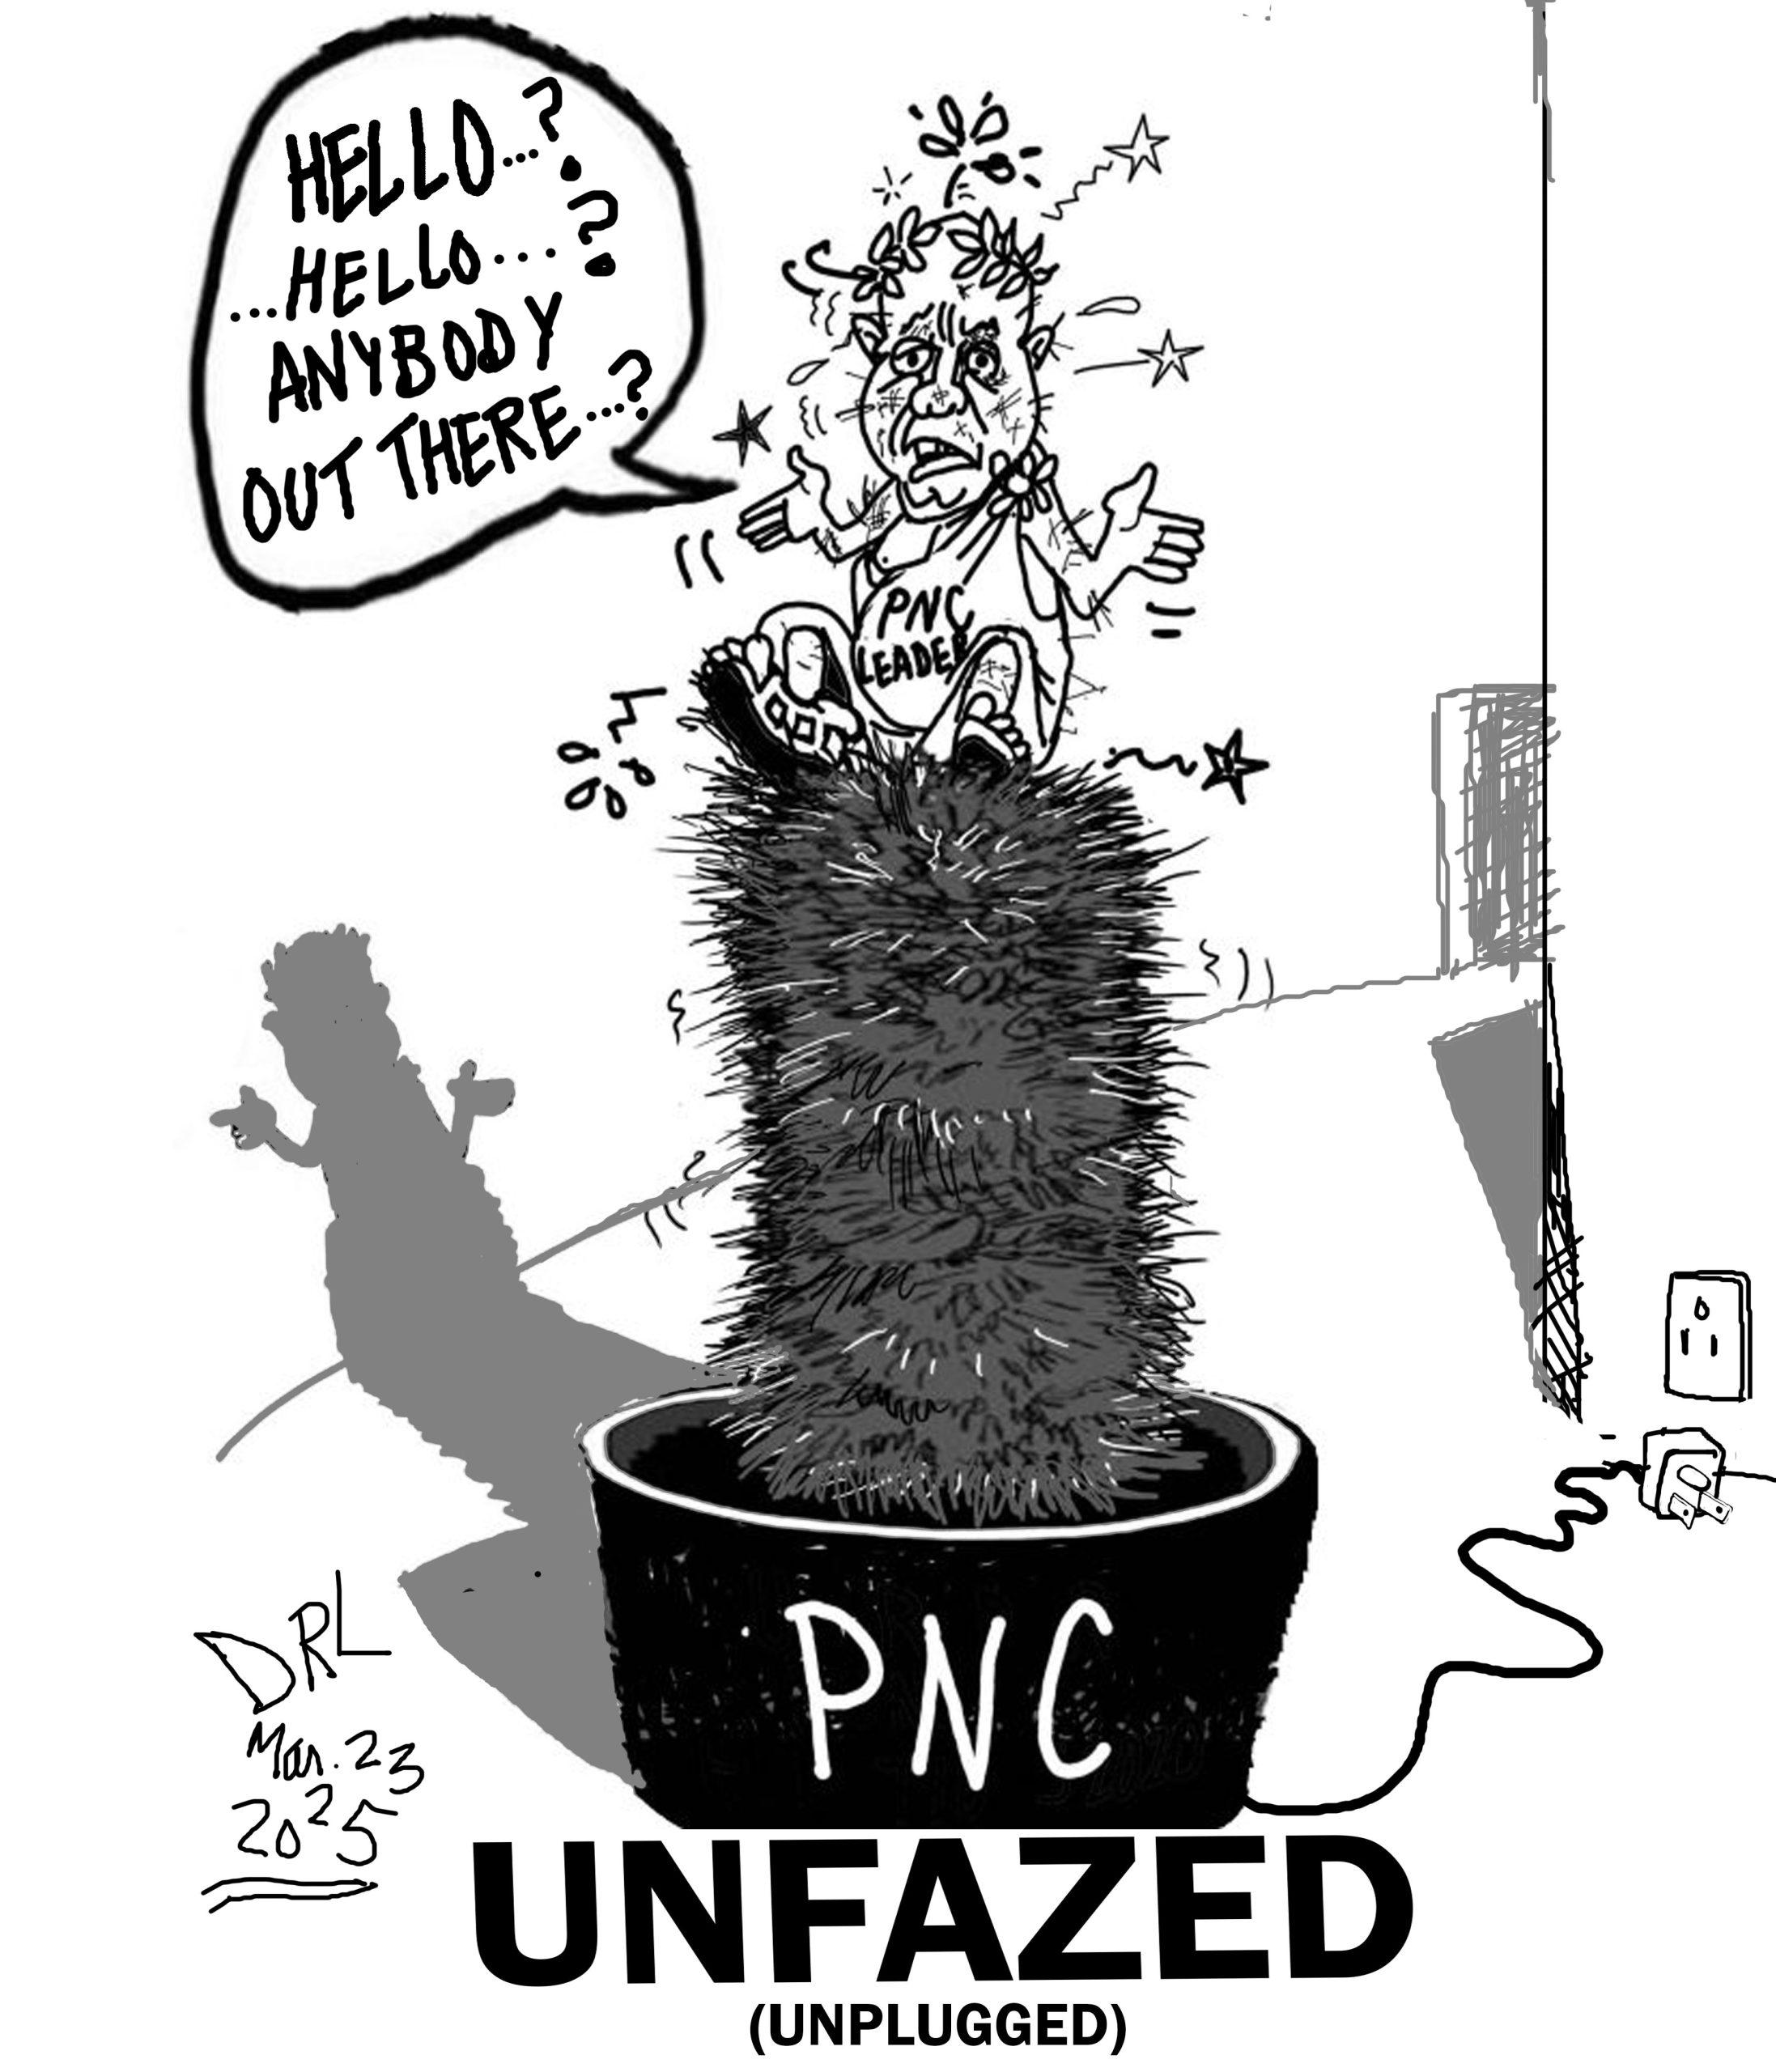
Weekend Cartoon


